
Finance, GST & Accounting · Accounting
Report Builder
Build your own report in Sayl Finance from invoices, bills, expenses or stock - choose the columns, filter, group and total, then save it or download it as CSV.
What it is for
Report Builder answers the question no fixed report does. Pick what the report is about, choose the columns, add filters, group and total the numbers, and run it - then save the definition for next time or download the result as a CSV for Excel.
It works on five kinds of record: Invoices, Invoice line items, Vendor bills, Expenses and Products & stock.
How it works
- A report is a definition, not a copy of the numbers. A saved report keeps only what you chose - the dataset, columns, filters, grouping and sort - and always runs against today's data, showing each viewer only what they are allowed to see.
- There are two modes. List rows gives one row per record with the columns you tick. Group & total groups by up to two fields and adds totals: a count of rows, or the sum, average, lowest or highest of a numeric field.
- Amounts are in each document's own currency. If you invoice in more than one currency, add a Currency filter or group by currency.
- Six ready-made starting points fill in the whole definition for you: Sales by customer, Invoiced per month, Overdue invoices, Sales by product, Expenses by category and Stock value. Change anything, then run or save it.
Step by step
Every screenshot is from the live demo. The highlighted button is the one to click - nothing here is saved in the demo, so you can follow along freely.
- 1
Open Report Builder
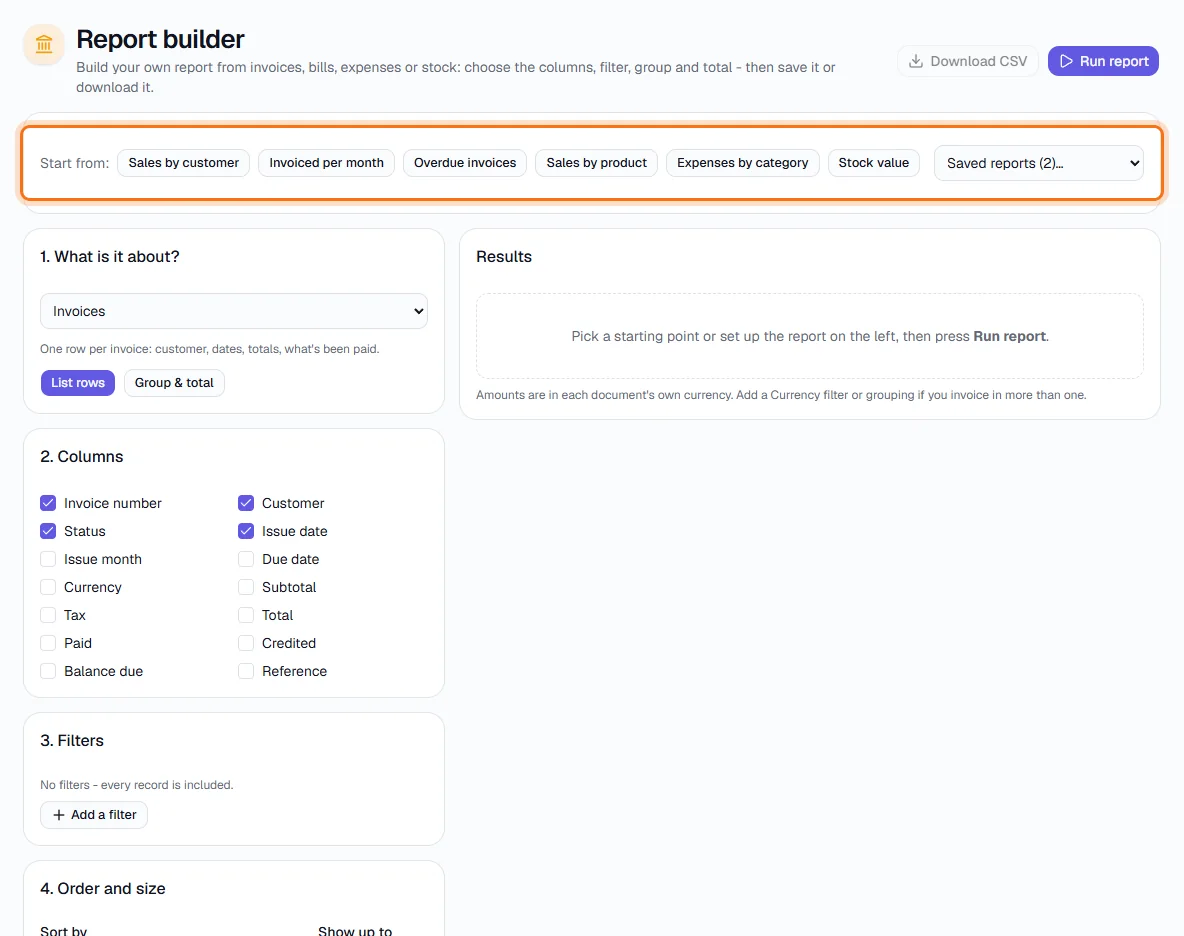
Finance → Accounting → Report Builder. The Start from row (highlighted) offers six ready-made reports and a Saved reports list.
- 2
1 · Choose what it is about
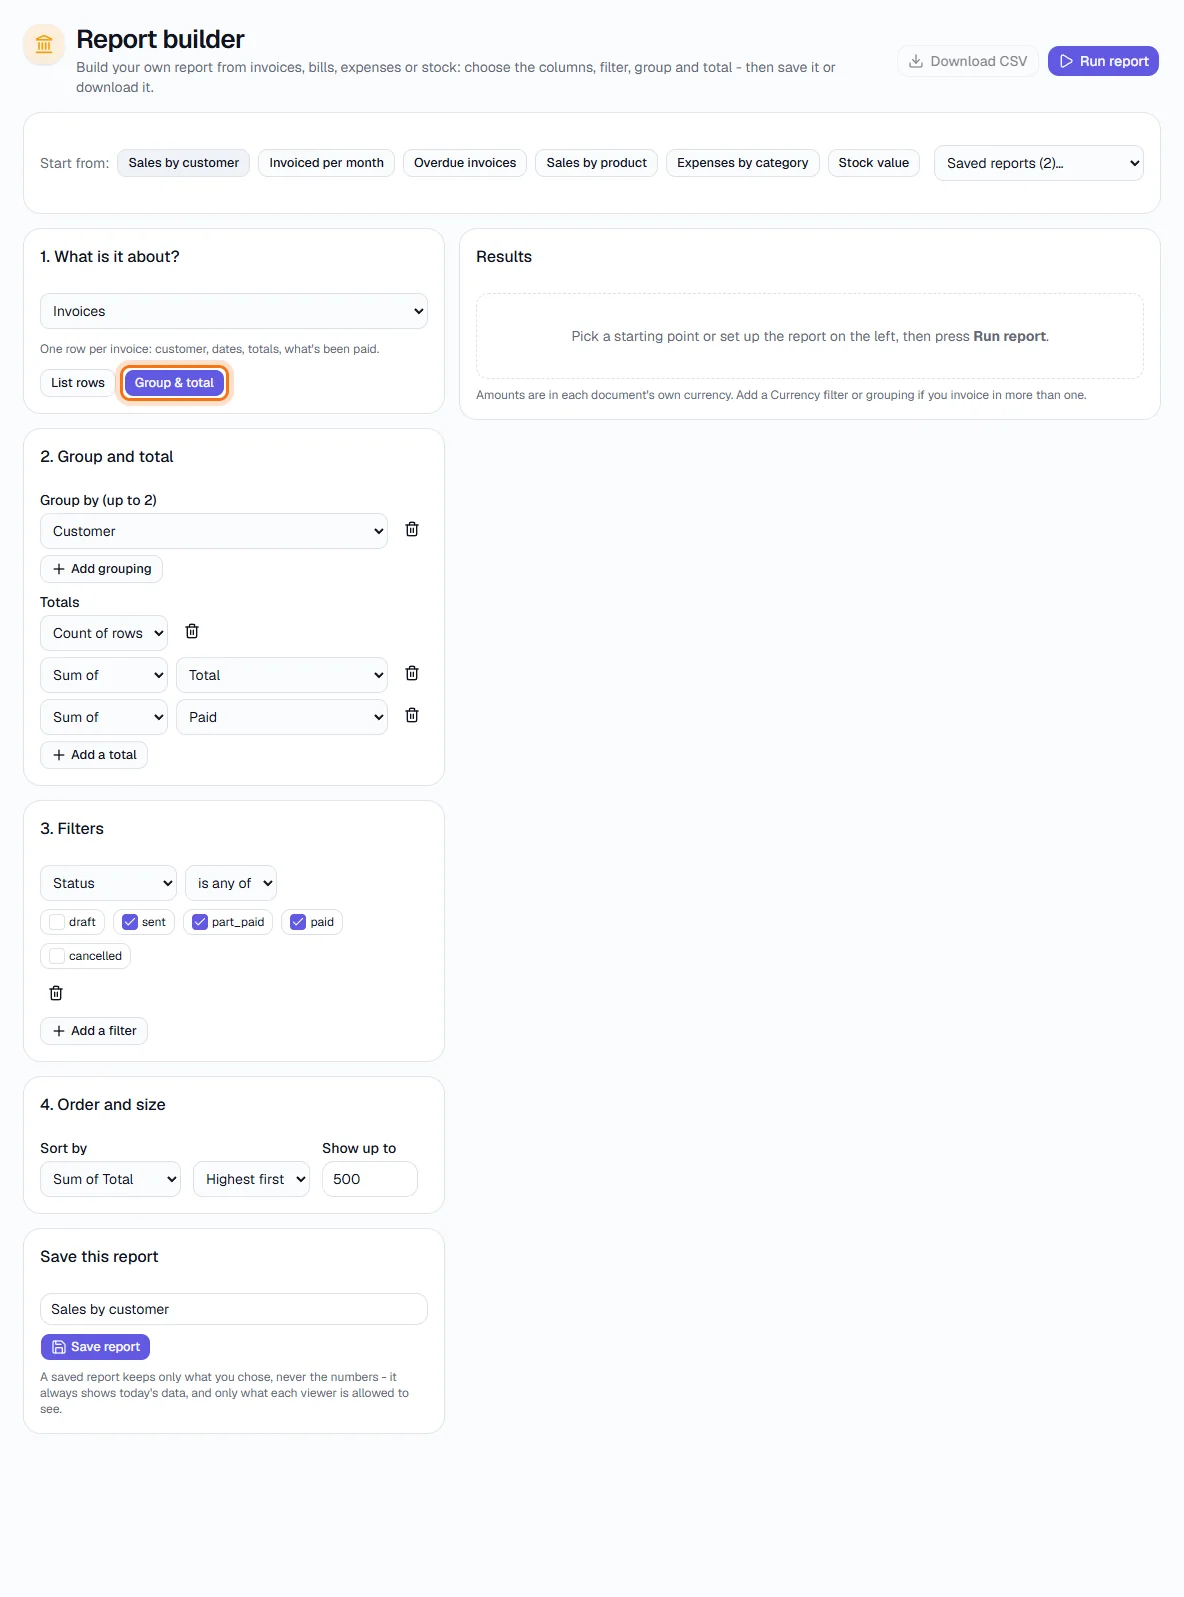
Pick the dataset - Invoices, Invoice line items, Vendor bills, Expenses or Products & stock - and whether to List rows or Group & total. Or click a Start from button: here Sales by customer sets up a grouped report (highlighted).
- 3
2 · Choose columns, or group and total
In List rows mode, tick the columns you want. In Group & total mode, choose what to group by (up to two fields) and the Totals - Count of rows, Sum of, Average of, Lowest or Highest of a field. Above, each total is added as its own column.
- 4
3 · Filter
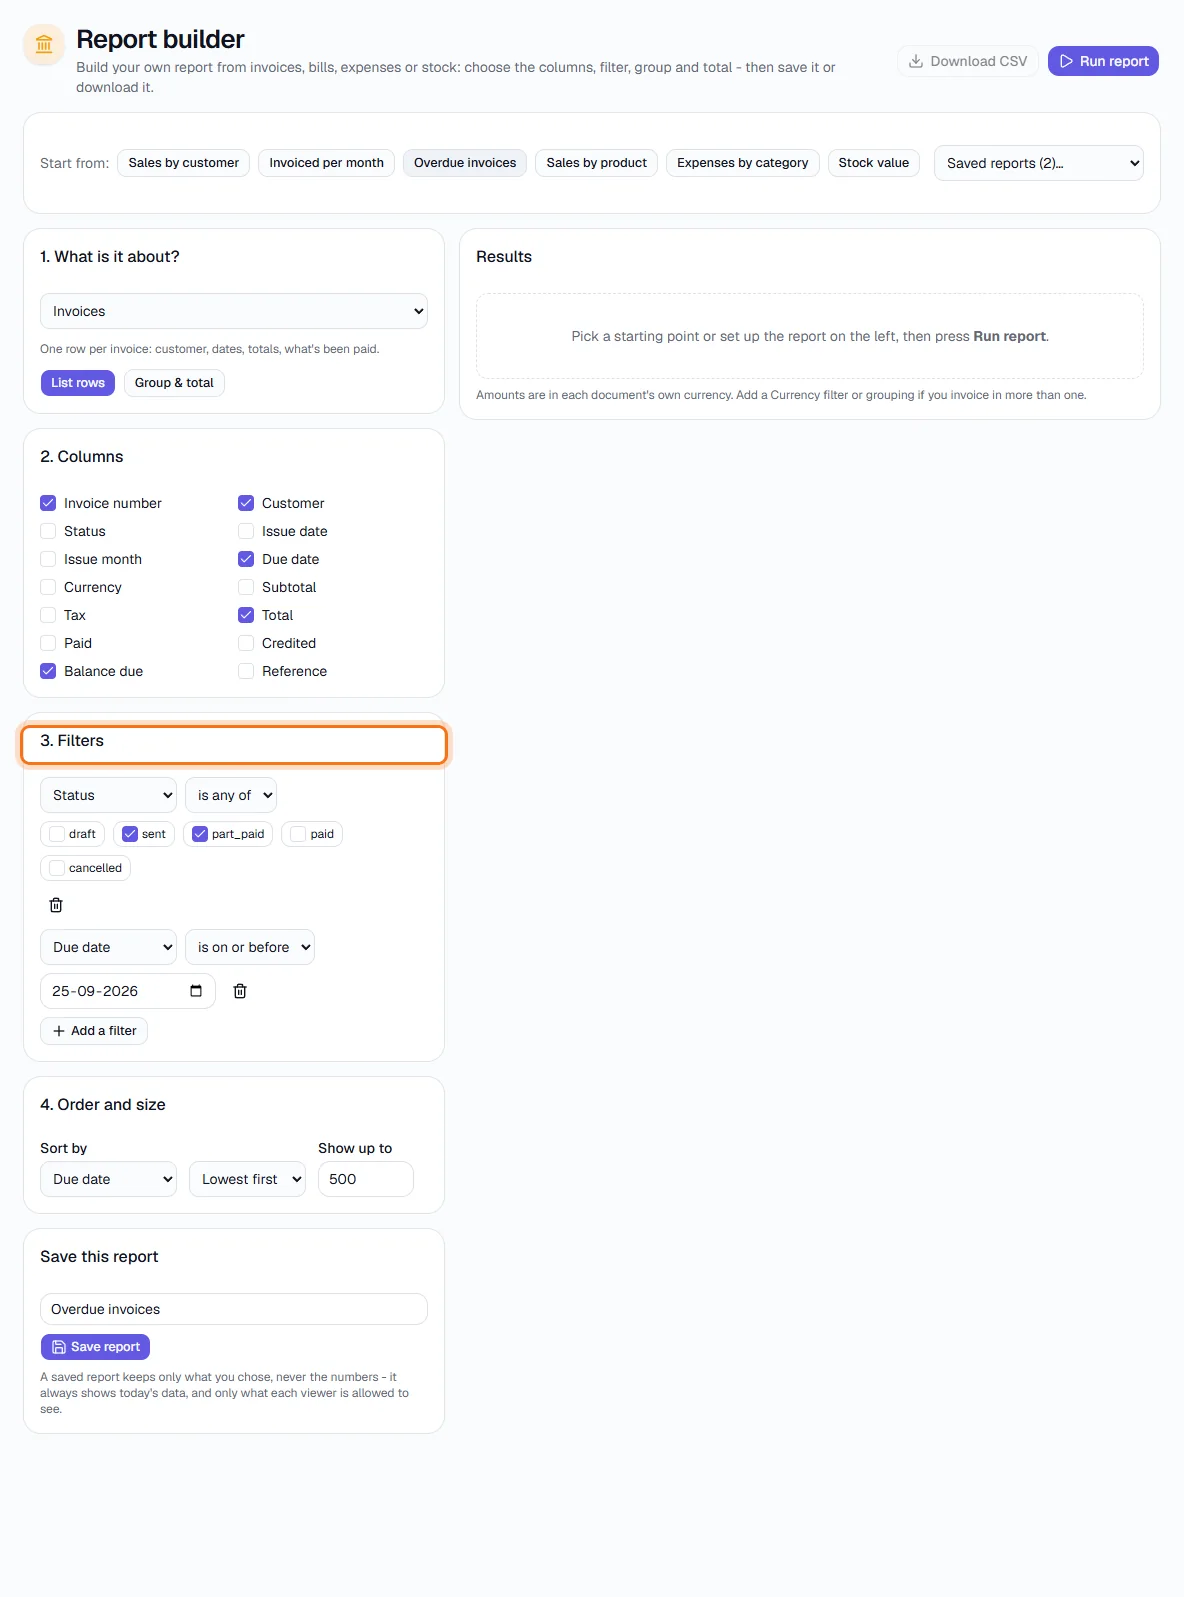
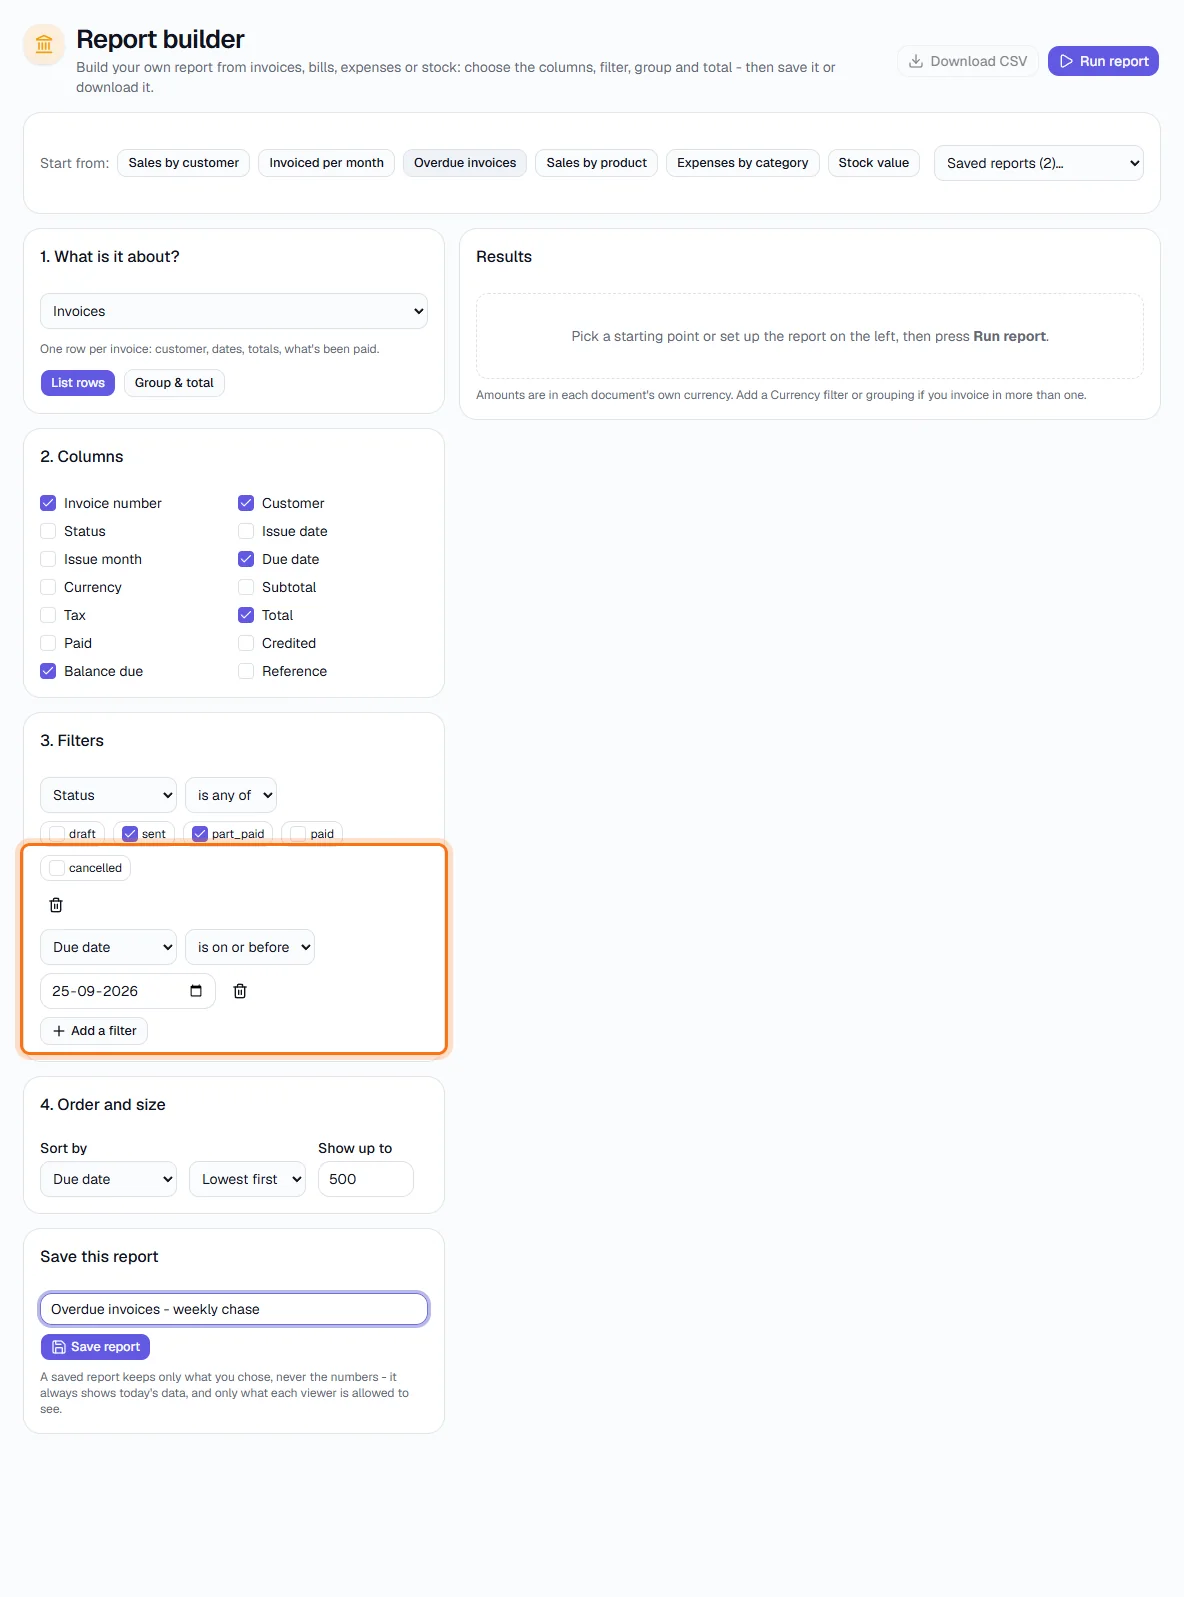
Click Add a filter and choose a field, a comparison (is, is not, is any of, contains, starts with, is more than or at least, and for dates is on / on or before / on or after) and a value. Every record is included until you add a filter. Here Overdue invoices filters to unpaid invoices due on or before today.
- 5
4 · Order and size
Choose the Sort by field and direction (Lowest first or Highest first), and Show up to how many rows - up to 1,000. If more rows match than are shown, the report says so; raise the limit or add a filter.
- 6
Run the report
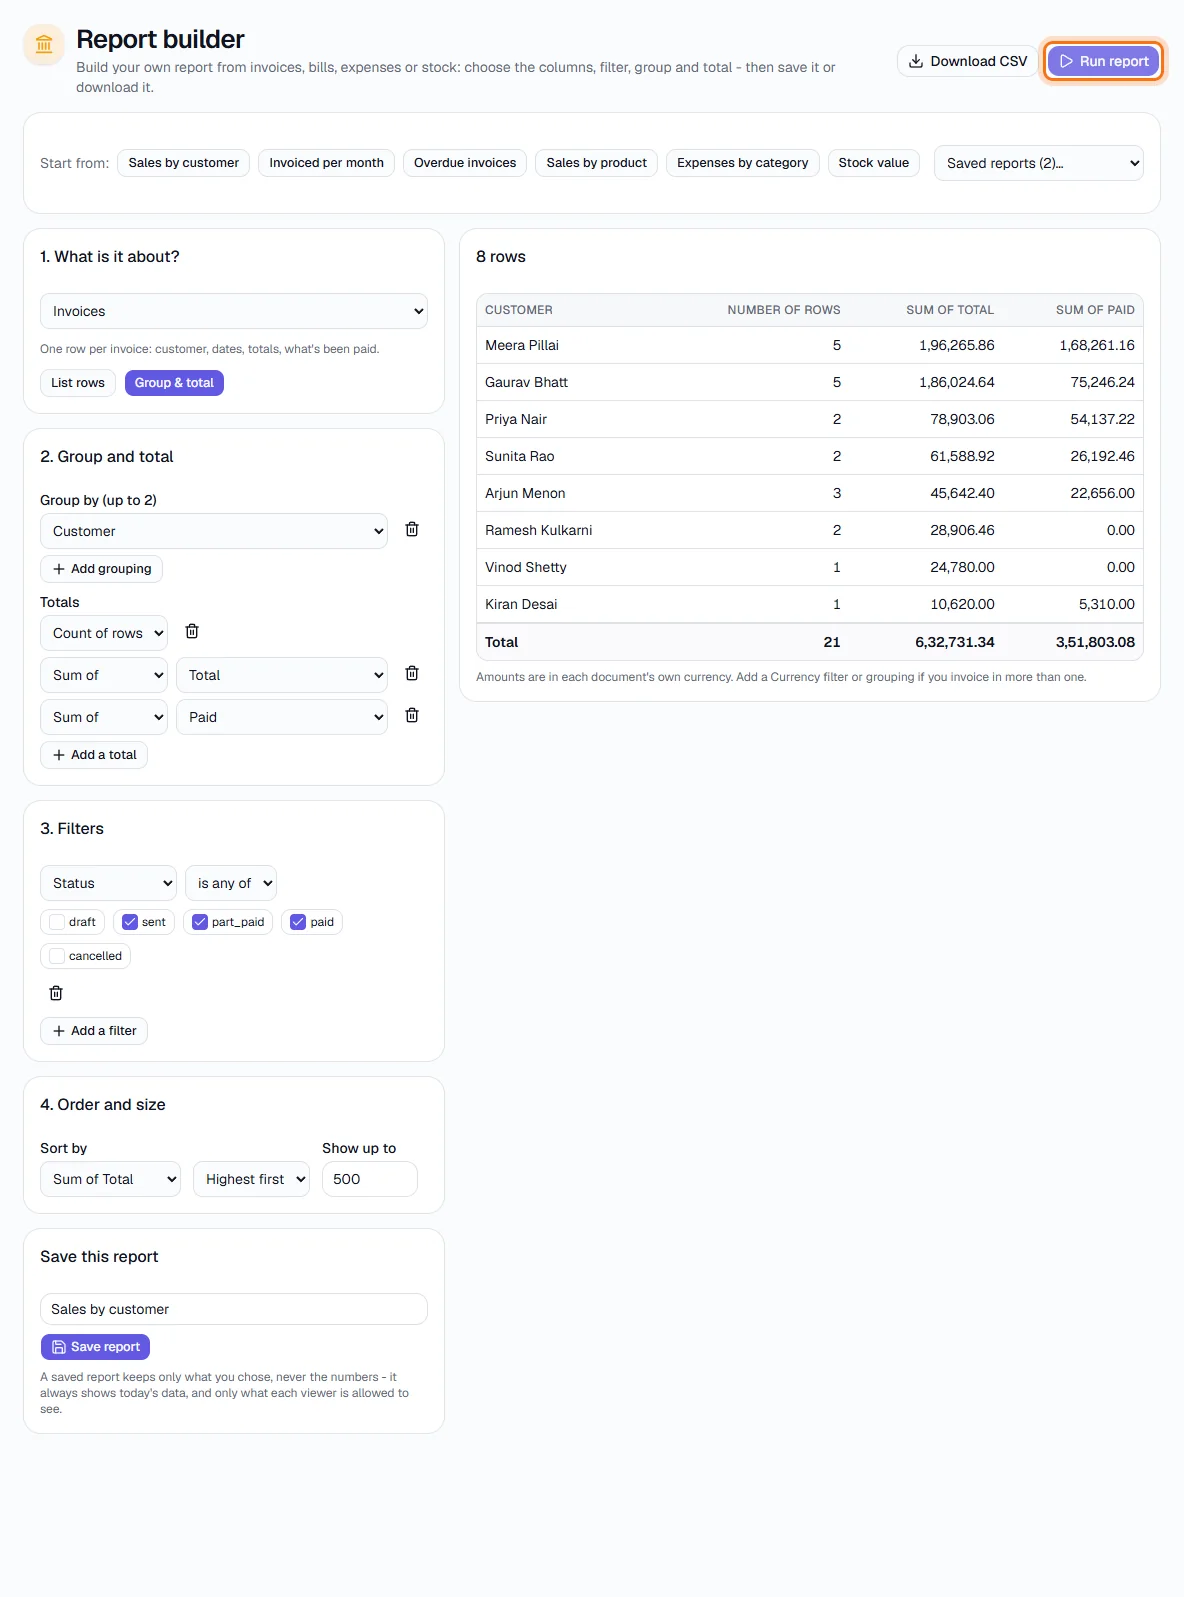
Click Run report (highlighted). The result appears on the right with a row count and, for grouped reports, a Total row.
- 7
Download it
After a run, Download CSV (highlighted) saves the result as a CSV file you can open in Excel.

- 8
Save it
Type a name under Save this report (highlighted) and click Save report. The definition is stored - not the numbers - so it is always current.
- 9
Open a saved report
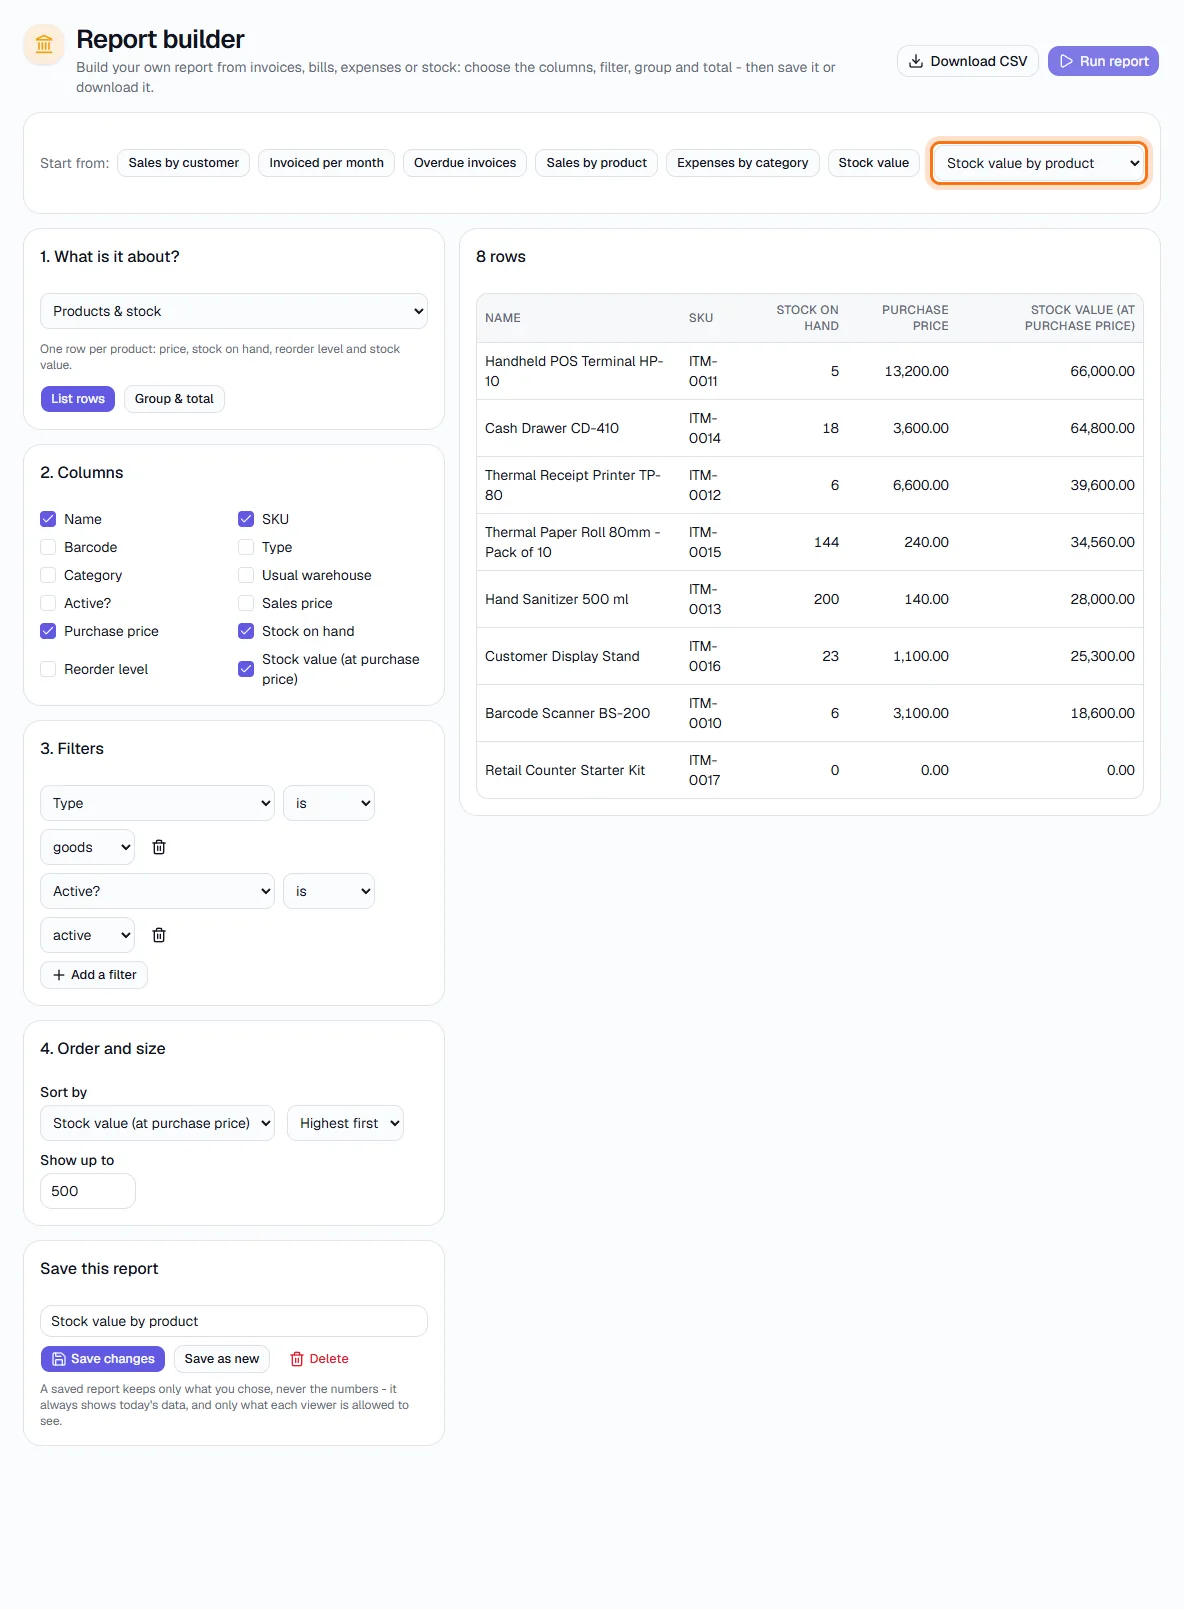
Choose it from Saved reports (highlighted). Its whole definition loads; click Run report to see today's figures. Save changes updates it, Save as new keeps the original, and Delete removes it.
Key fields
- What is it about
- Invoices, Invoice line items, Vendor bills, Expenses, Products & stock.
- List rows / Group & total
- One row per record, or grouped rows with totals.
- Totals
- Count of rows, Sum of, Average of, Lowest, Highest.
- Show up to
- Maximum rows returned, up to 1,000.
Tips
- Start from the nearest ready-made report and adjust it - it is faster than building from scratch.
- Group by Issue month for a month-by-month trend, and by Customer or Product to see who and what drives sales.
- A dataset you have no permission to view is not offered, and saved reports built on it are hidden from you.