Finance, GST & Accounting · Reports
Report Builder
Build your own reports in Sayl from any module - filter, group, total, chart in 20 styles, export to Excel or PDF, schedule, and put them on your dashboard.
What it is for
Report Builder answers the questions no fixed report does: which lead sources bring the most business, who owes you money for more than 30 days, which products sell best this quarter. Pick the data, choose the fields, filter, group and total, and see it as a table or a chart - then save it, export it, schedule it or put it on your dashboard.
It reads 30 data sources across the whole CRM - leads, quotes, sales orders, invoices, payments, purchases, expenses, the general ledger, stock and HR - plus cross-module summaries such as Customer 360 and Salesperson performance.
How it works
- A saved report is a definition, not a copy of the numbers. It keeps what you chose - the data source, fields, filters, grouping, totals, period, formulas and chart - and always runs on today's data, showing each person only the records their permissions allow.
- A report with no grouping lists one row per record. Group by up to three fields (for example Customer, then Month) and add totals - a count, or the sum, average, lowest or highest of a number field - to get one summary row per group and a Total row.
- A period limits the report to records dated in a range (This month, This quarter, This FY…), and Compare with adds the previous period or the same period last year with the % change. Ready-made formulas add calculations such as margin %, collection % or growth % without typing anything.
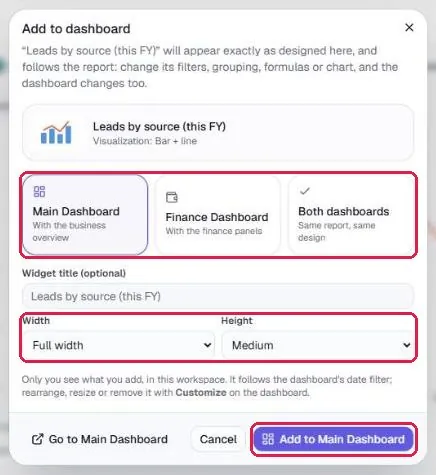
- Results show as a table or one of 20 visualizations: bar, line, trend, pie, stacked bars, bar + line, donut, treemap, funnel, pipeline, KPI cards, gauge, progress bars and more. Any saved report can be added to the Main or Finance dashboard in exactly that design, and it follows the dashboard's date filter.
Step by step
Every screenshot is from the live demo. The highlighted button is the one to click - nothing here is saved in the demo, so you can follow along freely.
- 1
Open Report Builder
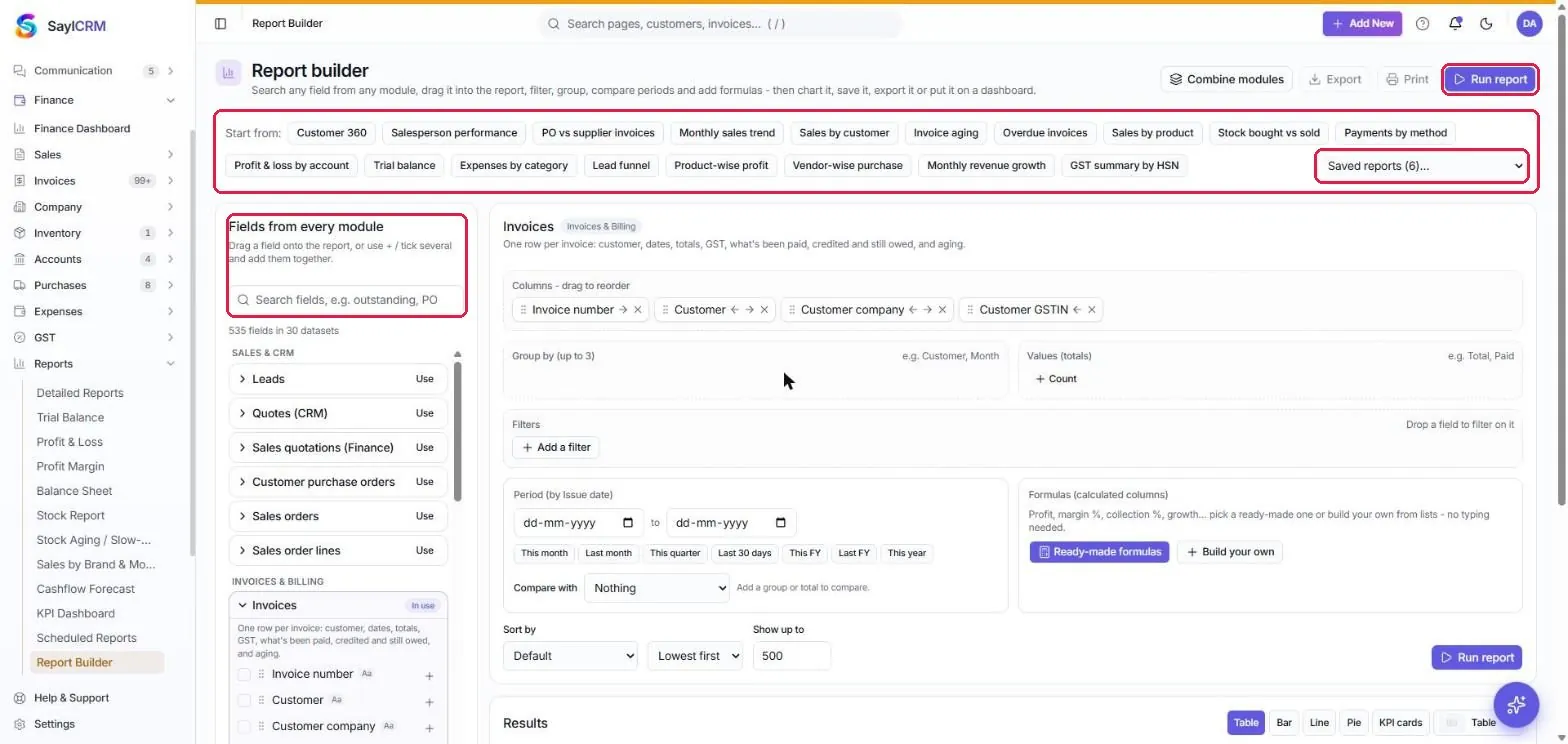
Finance → Reports → Report Builder. Ready-made reports sit in the Start from row, your saved reports in the Saved reports list, and every field of every module in the panel on the left (highlighted).
- 2
1 · Choose the data source
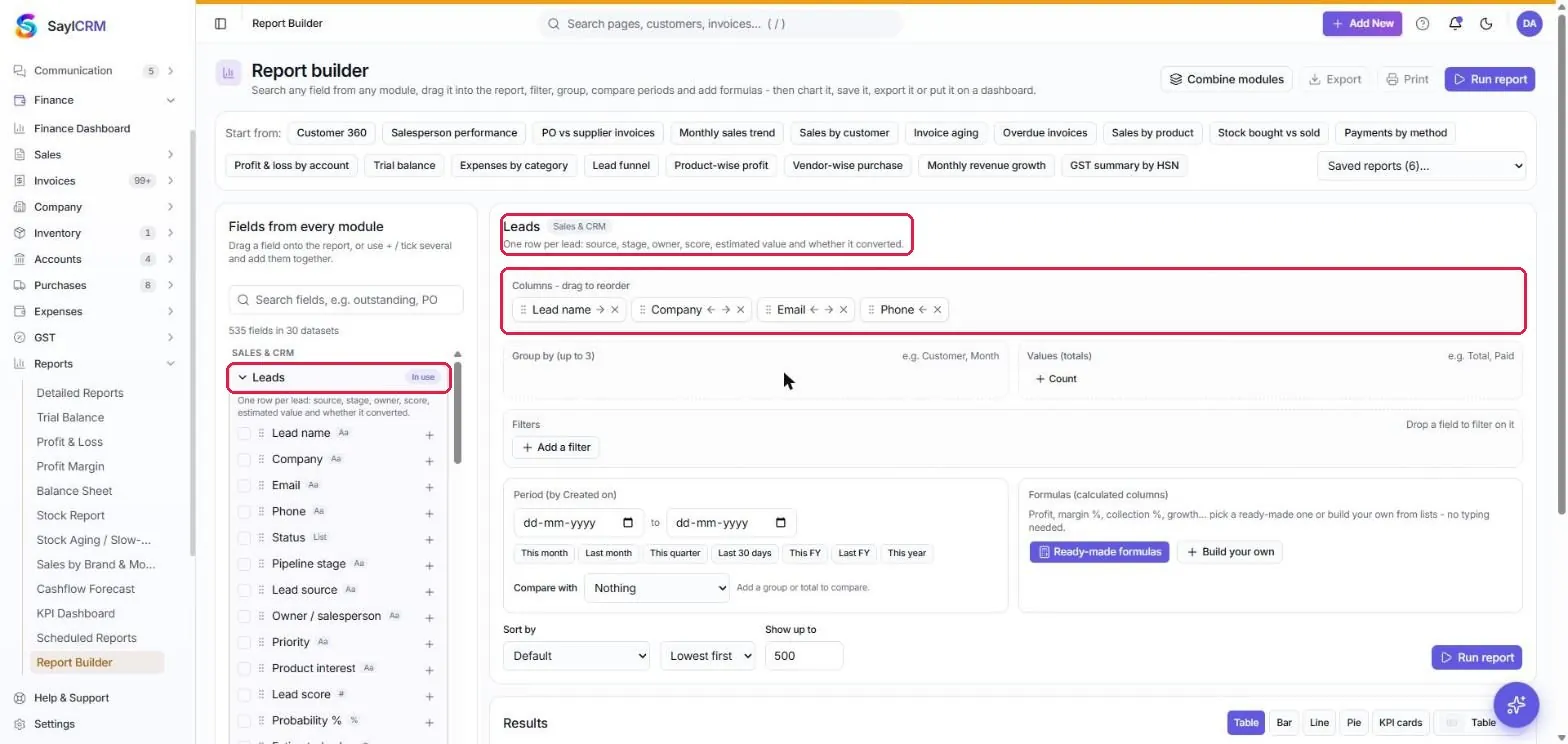
Click Use next to a data source - here Leads. It shows as In use, with a one-line description of what one row is. Or click a Start from button to load a complete report you can adjust.
- 3
2 · Add fields
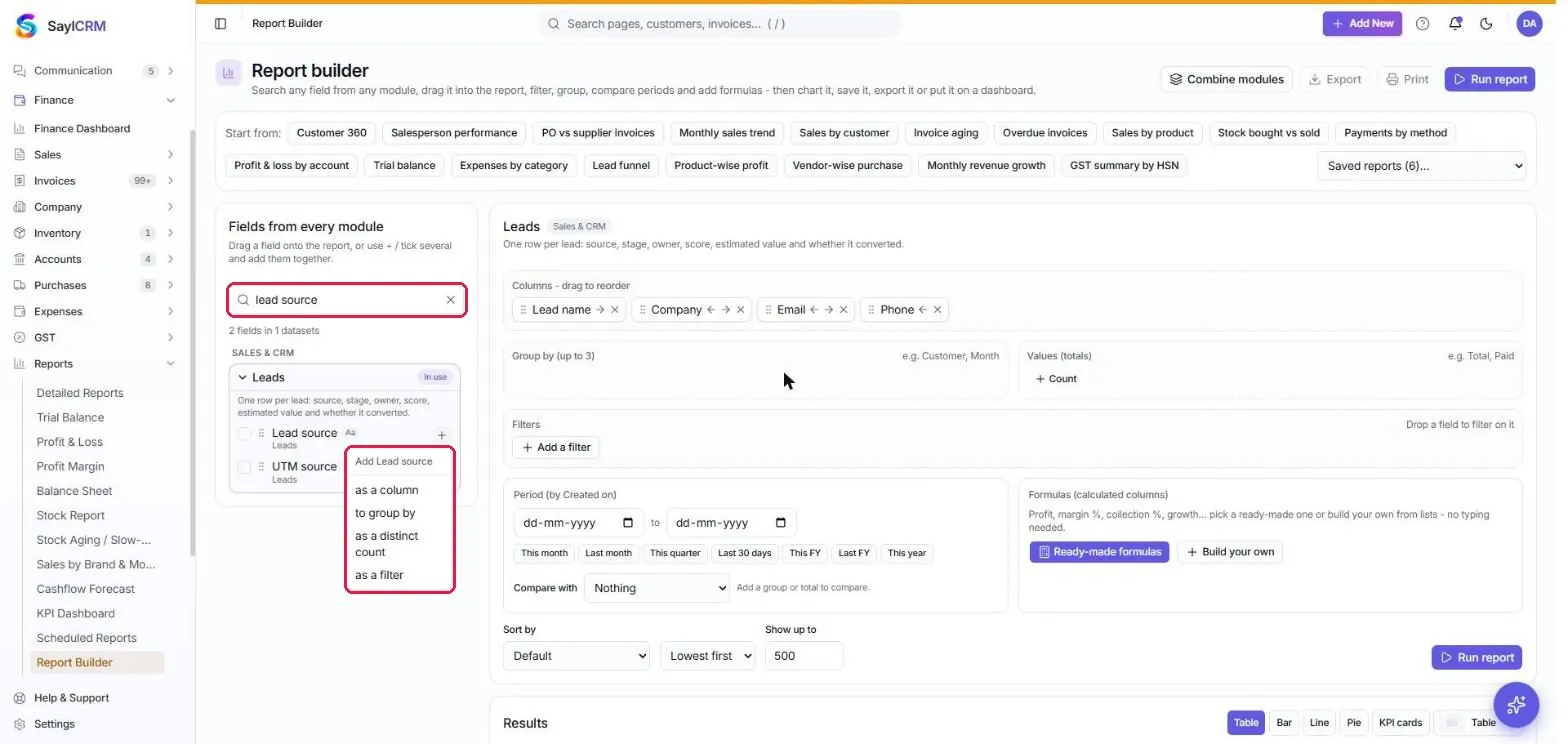
Search for any field, click + and choose where it goes: as a column, to group by, as a total, or as a filter. You can also drag fields onto the report, or tick several and add them together.
- 4
3 · Group and total
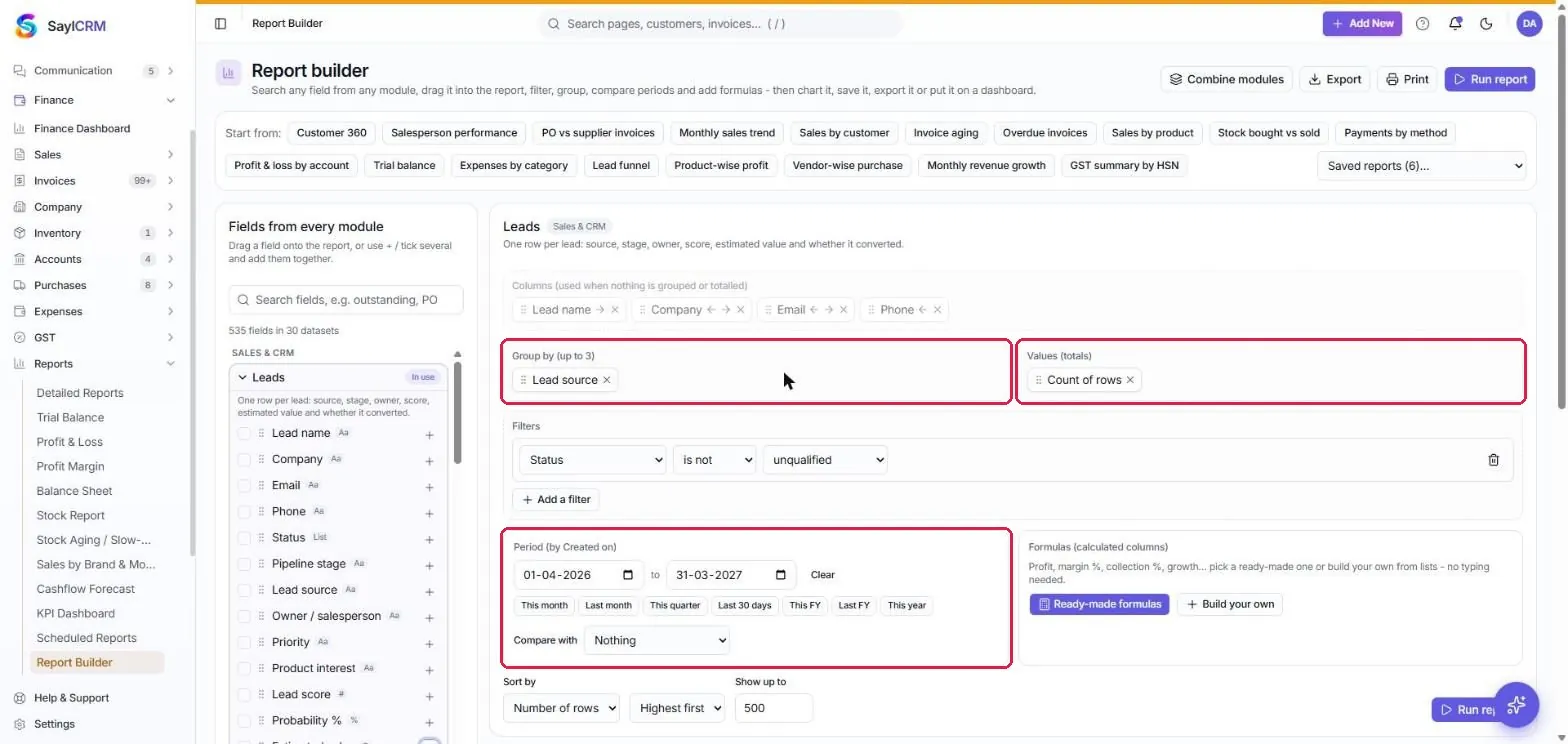
Group by up to three fields and click + Count, or add number fields as totals (Sum, Average, Lowest, Highest, Distinct count). Set the period - here This FY.
- 5
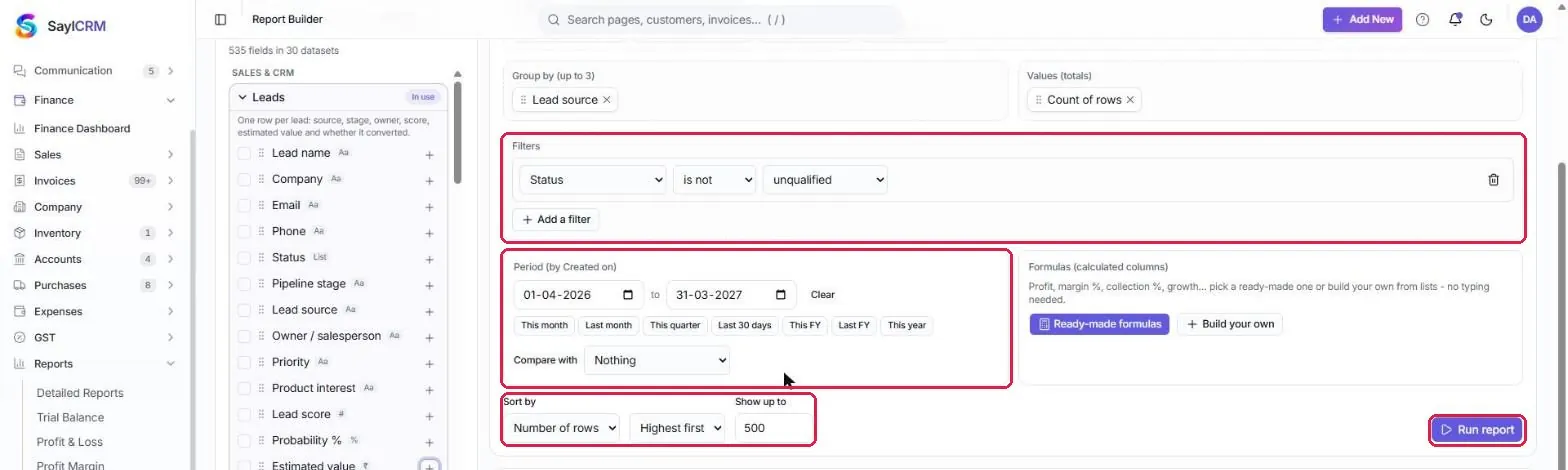
4 · Filter, sort and run
Add filters (is, is not, is any of, contains, is between, is on or after…), choose Match all or any when there are several, pick the sort order and how many rows to show (up to 1,000), then click Run report.
- 6
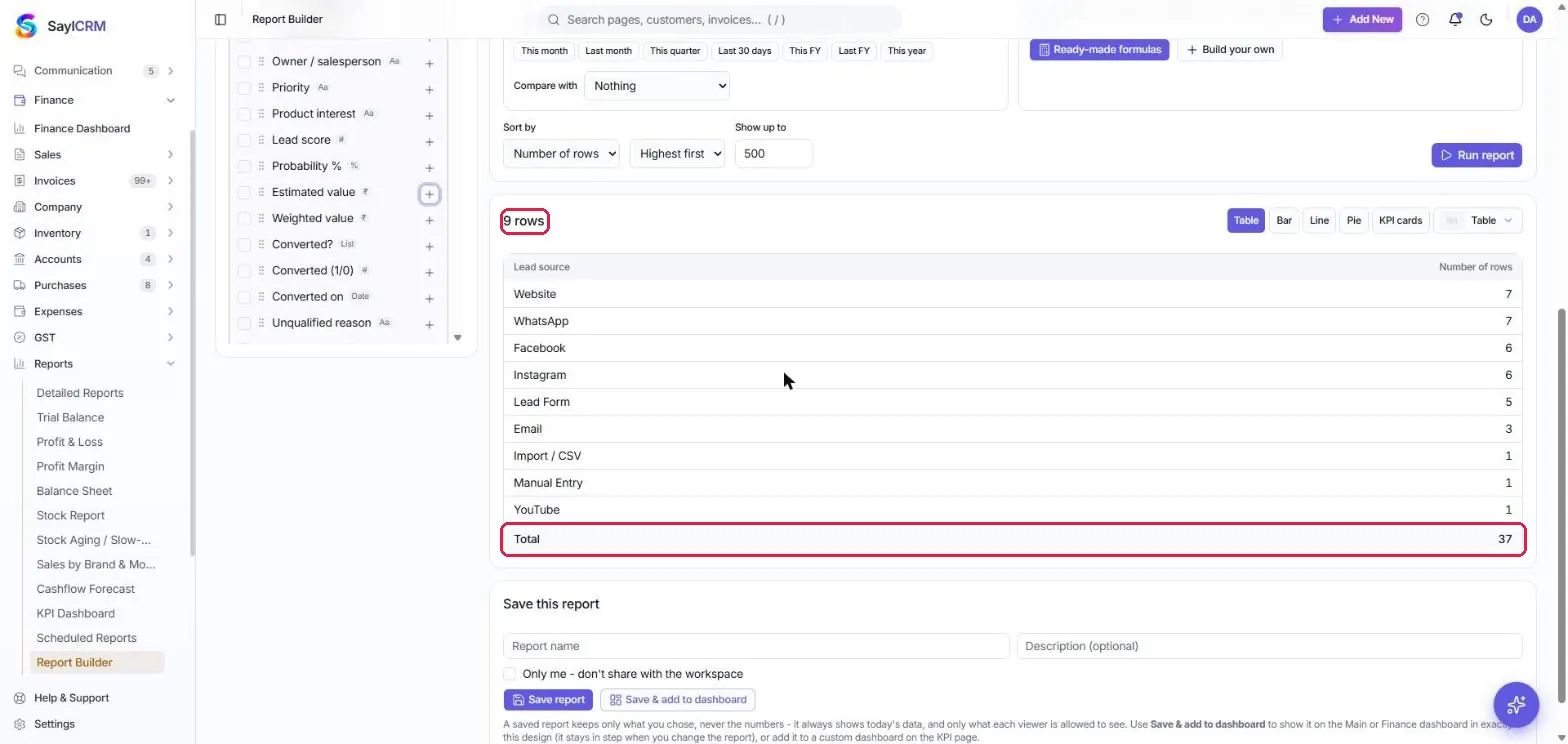
Read the result
The result shows the row count and, for summaries, a Total row.
- 7
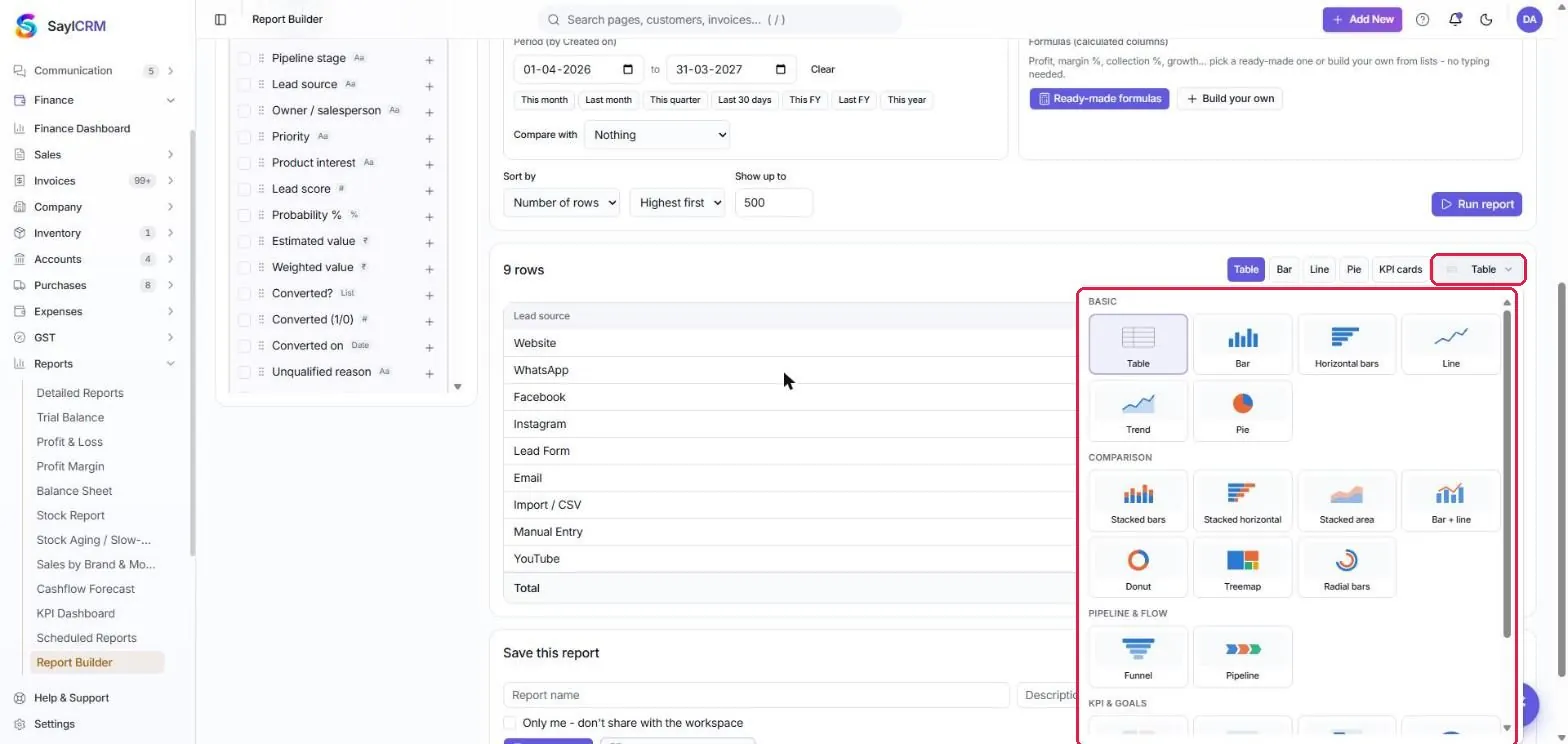
5 · Choose how to show it
Use the quick buttons (Table, Bar, Line, Pie, KPI cards) or open the gallery for all 20 visualization styles, grouped as Basic, Comparison, Pipeline & flow and KPI & goals.
- 8
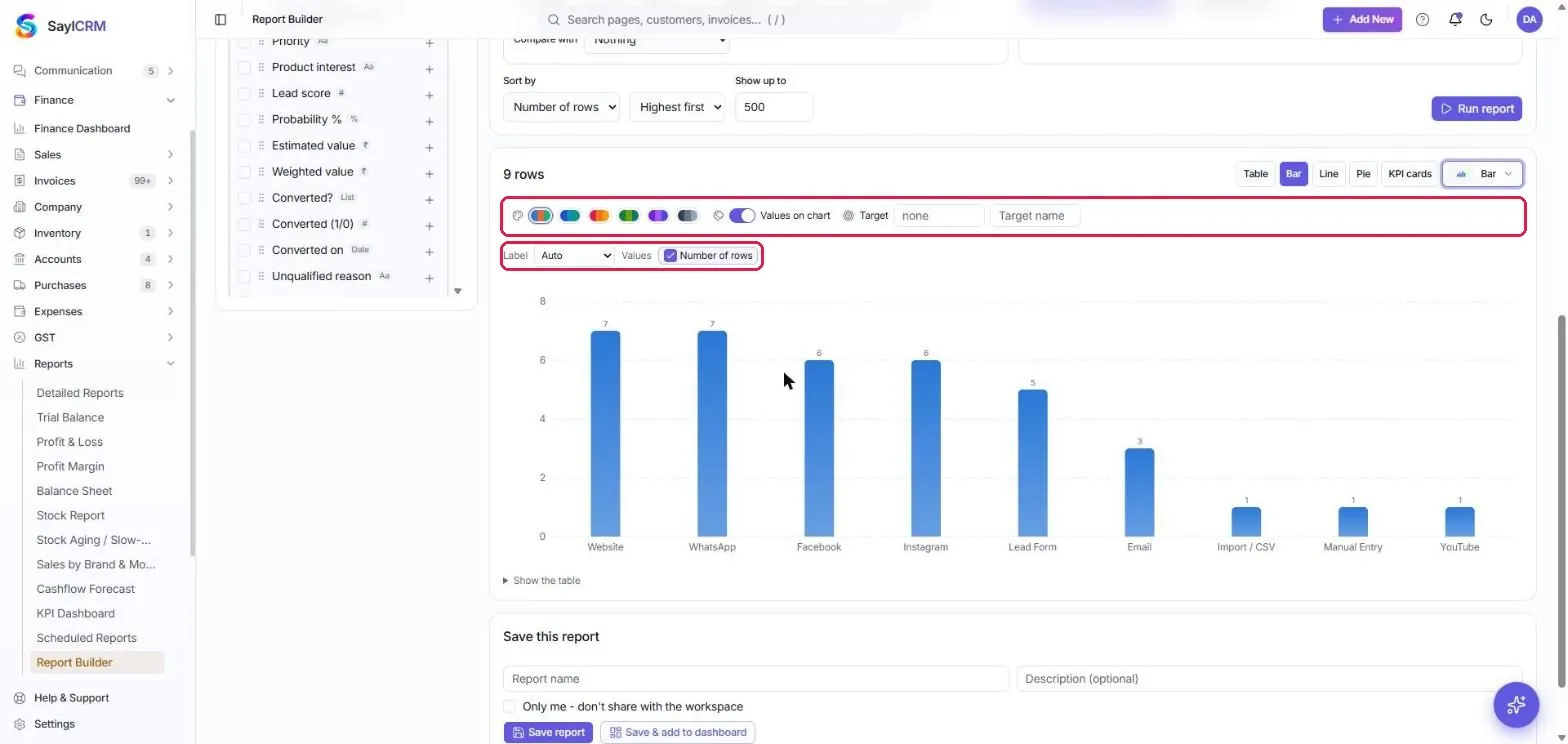
Style the chart
Pick a colour palette, print values on the chart, draw straight or smooth lines, and set a target with its name. Label and Values choose which columns the chart draws.
- 9
6 · Save it
Type a name (and a description) and click Save report. Tick Only me to keep it private. Saved reports also get Save as new, Duplicate, Schedule & Distribution and Delete.

- 10
Add it to your dashboard
Save & add to dashboard puts the report on the Main Dashboard, the Finance Dashboard or both, half or full width, in exactly this design.
- 11
See it on the dashboard
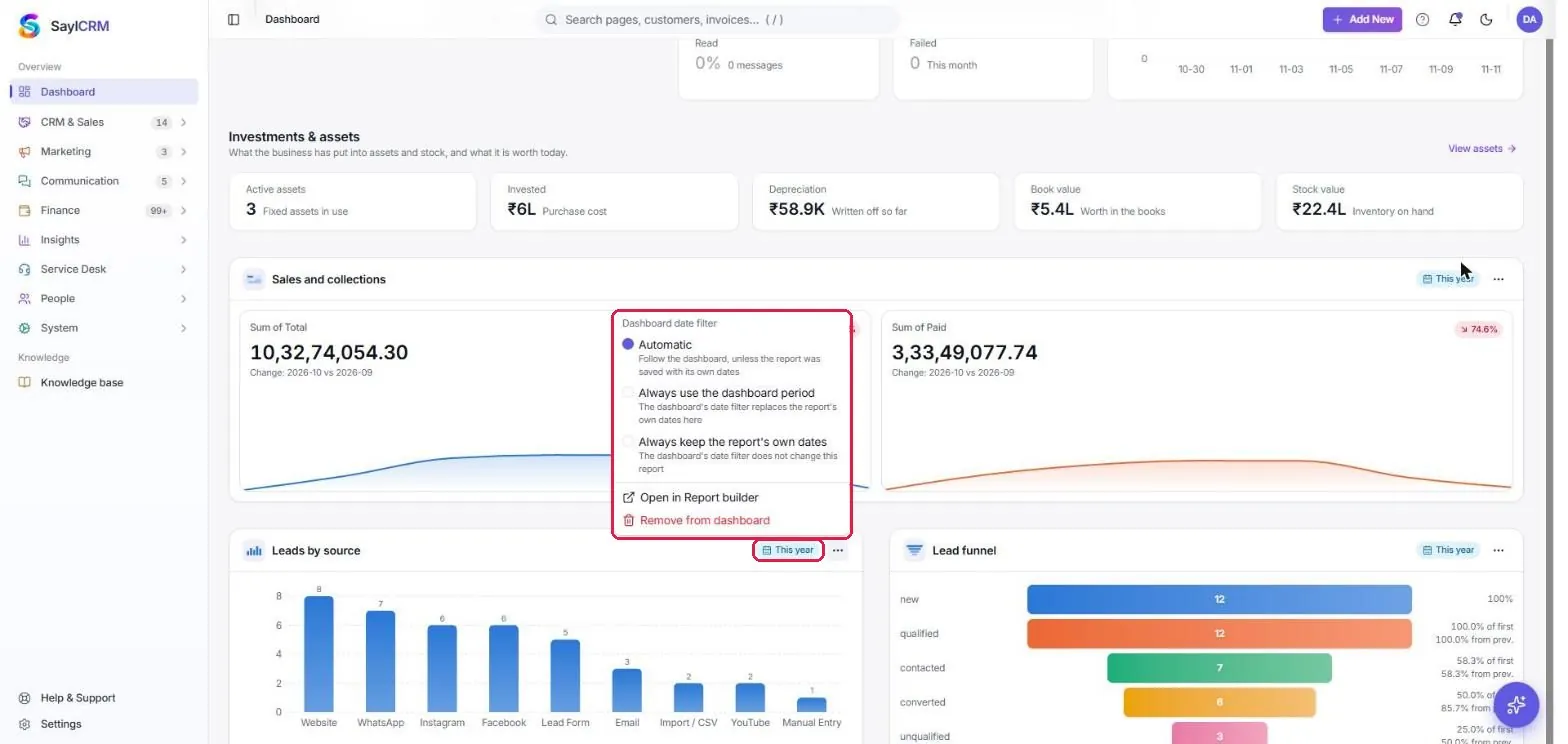
Each report widget follows the dashboard's date filter (the badge shows which dates it used). Its ⋯ menu sets how the date filter applies, opens it in Report Builder, or removes it. Customize on the dashboard moves and resizes widgets.
- 12
Export or print
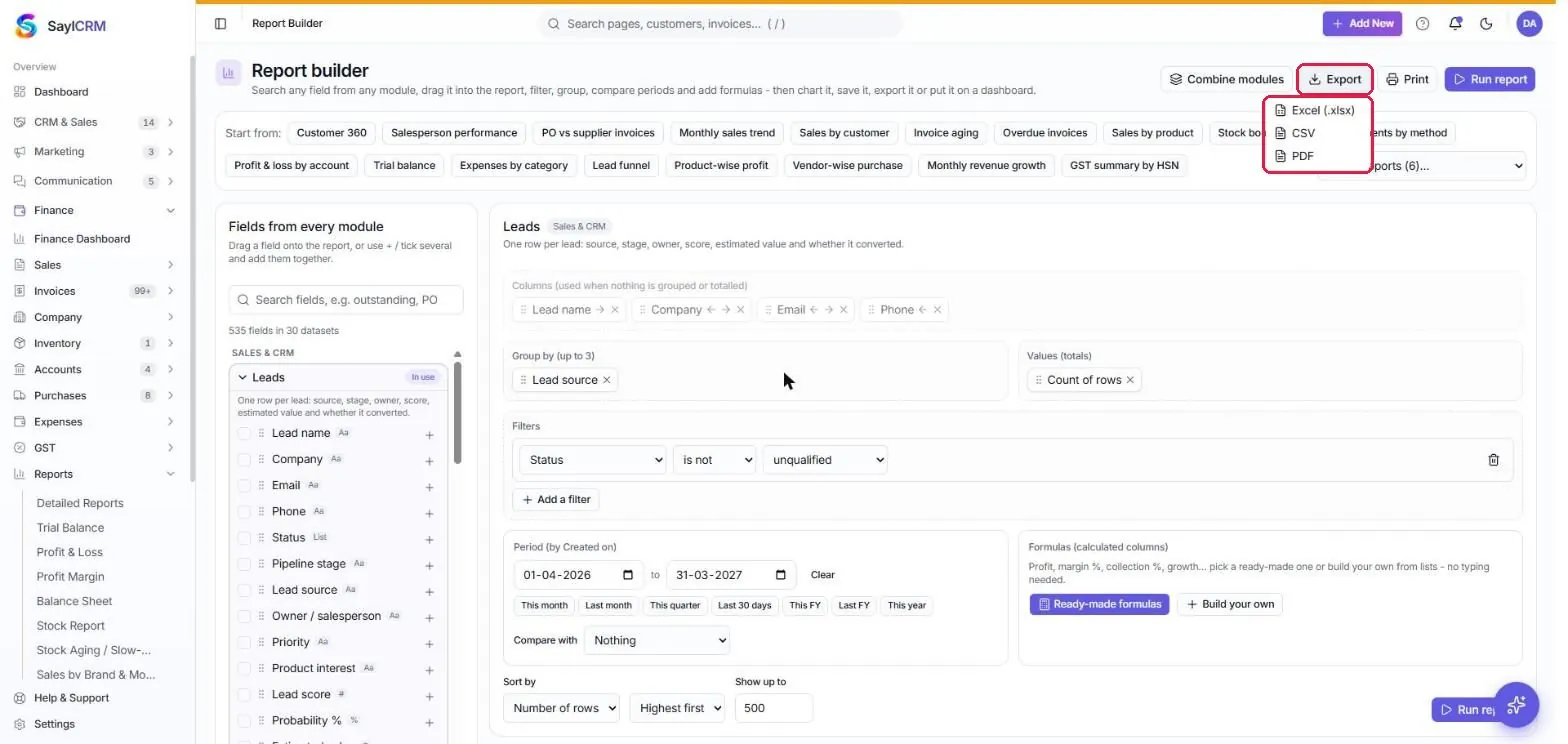
After a run, Export downloads the result as Excel (.xlsx), CSV or PDF; Print prints it or saves it as PDF.
Key fields
- Data source
- 30 sources: Sales & CRM, Invoices & Billing, Payments, Purchases & Vendors, Accounting, Inventory, HR, and cross-module summaries.
- Columns / Group by / Values
- List rows, or group by up to 3 fields with Count, Sum, Average, Lowest, Highest or Distinct count.
- Period / Compare with
- A date range with quick picks; compare with the previous period or the same period last year.
- Formulas
- Ready-made business calculations or your own, up to 6 per report.
- Show up to
- Rows shown, 1 to 1,000.
- Visualization
- Table and 19 chart styles, with palette, value labels and target.
- Save options
- Private or shared with the workspace; Save as new, Duplicate, Schedule & Distribution, Delete.
Tips
- Start from the nearest ready-made report and adjust it - it is faster than building from scratch.
- Group by a month field (Issue month, Created month) for a trend, and by Customer, Product or Salesperson to see who and what drives the numbers.
- A report saved without a period follows the dashboard's date filter; one saved with its own period keeps it unless you change the widget's date option.
- A data source you have no permission to view is not offered, and saved reports built on it are hidden from you.